A device’s view contains all the high-resolution information collected for that device, and would typically be your starting point for troubleshooting issues for a specific device (for viewing and comparing metrics from multiple devices at once, see Reports & Dashboards.)
To access a device’s view of metrics:
- Click on Finder on the far left of your screen, locate the device name in the ‘Devices’ list, and click the row itself (not the ‘Edit’ button).
- Click the device’s name in any email or SMS alert notification, which will automatically open a browser window with the device view.
- Click the name of a device anywhere it is listed in the dashboard, such as in the list of alerts, will typically open the device view as well.
Device-specific Layouts
When you open a device, typically by clicking on it in the Finder, it will present all recent collected data in a new tab within NiTO’s main view port . The information for each device may be laid-out very differently depending on the type of device. For example, an agent has a lot of intricate data spread across several detailed graphs on one tab, whereas a network switch will give you a rough estimate view of the actual physical layout of its rare ports, and a simple ping device will be presented as just one graph and a list of data-points.
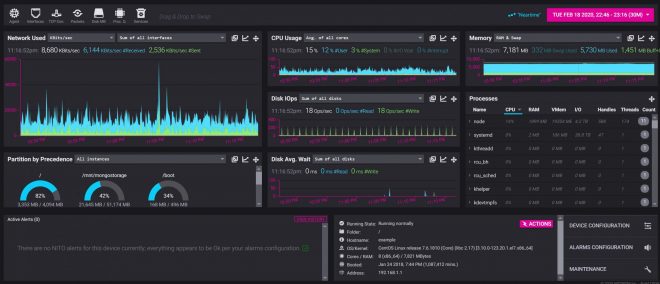
A typical agent view is nearly equivalent regardless of the OS (i.e., Windows or Unix/Linux), with a variety of metrics, including time-series data for all running processes on the system:
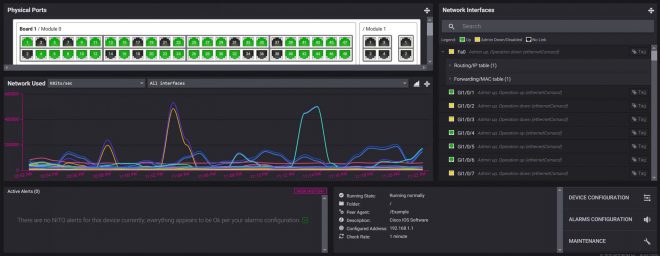
An SNMP peer device; a 48+ port switch including a visual representation of the port layout, a time-series graph for bandwidth usage, and a list of all current MAC/IP addresses that are active in the ARP table:
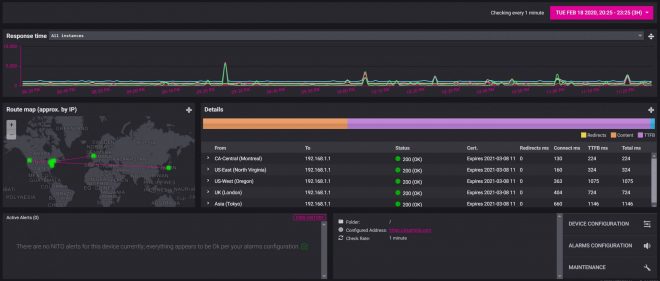
A typical HTTP(S) agentless device displays time-series data for each geographical location being checked from, including various transfer timings from time-to-first-byte to content download time:
Widgets and Common Controls
A device view is segregated into widgets for each type of metric. Widgets for instanced-based metrics include a drop-down menu listing all instances, for example “Partition C:\”, “Partition, D:\”, etc. Most widgets can be resized and moved around by swapping places with other widgets within the device view (changes you make to the device view during your session are not stored permanently). Widgets for which there is an associated active alert will also include a thick border along the top of it to highlight where to look for active problems.
When there are more metrics/widgets than can fit onto your screen (such as the case with agents), less commonly used widgets and extension will overflow into the toolbar along the top of the view. The main toolbar also includes a date/time range selector to the right.
Along the bottom of the view for all device types you’ll find a list of any active alerts, basic information about the device, and shortcut buttons for configuring the device.