MONITOR YOUR ENTIRE IT INFRASTRUCTURE

START MONITORING IN SECONDS »
For a limited time, add 5 devices to monitor for free, no credit card required.

Custom Metrics & Visuals

Customized metrics to suit your unique business requirements.

  • Plug in to your applications and infrastructure with our intuitive API
  • Customizable dashboards for live analysis, ideal for big overhead display
  • Put the data you need the most front-and-center, on multiple dashboards
Learn More

Actionable Alerts & Notifications

High-visibility into your entire infrastructure’s performance and health.

  • Choose to receive alerts via email, SMS or verbal phone notifications
  • Decide when and why to receive alerts based on severity of issue
  • Escalate alert notifications and reminders, or acknowledge to fix later
Learn More

Bandwidth & SNMP Monitoring

Interactive charts and graphs allow you to observe and monitor IPs, bandwidth and more.

  • Track and correlate data for your SNMP router/switch/UPS/etc., in realtime
  • Monitor from inside your own network, without Internet firewall exceptions
  • Identify devices attached to hardware ports and their traffic usage
Learn More

Detailed OS & Process Monitoring

Monitor operating systems and data collection in intervals of seconds, not minutes.

  • Automatically identify and monitor data from all running processes and services
  • Default of 4-second collection interval for all components local to the agent
  • Unbiased and equivalent monitoring of both Windows and Linux OSs
Learn More

Distributed HTTPS & Ping Monitoring

View, monitor and analyze your uptime from anywhere in the world.

  • Monitor your infrastructure from multiple locations across the globe
  • Ability to monitor over the Internet or from inside your network
  • Monitor HTTP(S); Ping/ICMP; DNS; etc., including status, TTFB and more
Learn More

Health & Inventory Reporting

Be in the know with automatic and detailed reports.

  • Schedule recurring reports to be delivered automatically via email
  • Trend analysis for infrastructure performance, health and protection
  • Pre-configured reports including "95th percentile", "inventory", and more.
Learn More

Monitor

We were made to do precisely this. Get started right away with the only dashboard that delivers insights on even the most complex networks through a single source.


Up-to-the-minute information

Beautiful, intuitive displays

Every element in your network

Prioritize

Clear, simple information delivered to you when and how you want it means you can make split-second decisions about what gets your attention first – and what needs to be done.


Custom alerts by phone or email

Clear, actionable insights

Critical information - fast

Optimize

Why wait for downtimes and delays to show you where your infrastructure is struggling? Identify your challenges earlier and fix them without breaking a sweat.


Identify issues earlier

Add and remove items with ease

Detailed historical data

Features

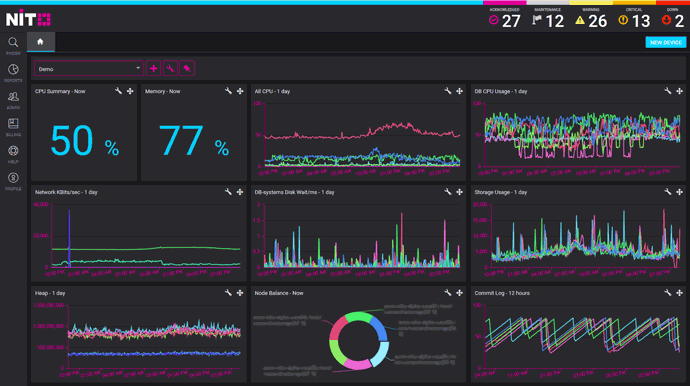
Multiple infrastructure elements.
One source to monitor them all.

NiTO is an all-in-one infrastructure monitoring solution that allows you to find – and solve – issues
before they become issues.

High-resolution OS monitoring

NiTO monitors Windows and Linux OSs with a default of 4-second resolution for each local component, service and process – it’s as near to real-time as you can get.

HTTP(S), Ping, and TCP uptime

Whether you’re on the other side of the world or the other side of the office, you can access NiTO and monitor via the Internet or an agent within your local network.

SNMP network monitoring

Get a clear view from our single-source dashboard to monitor status, traffic, IPs and MAC addresses on SNMP capable switches, routers, power-supplies, and more.

Custom metrics

Your infrastructure is unique. Plug in to your apps, analyze and trigger alerts with NiTO's RESTful API and third-party extensions. If you can imagine it, you can create it.

Custom notifications

We provide convenient options so you can schedule what you need to know on your own terms. Choose email, SMS or phone call notifications, and your team can do the same.

Acknowledgements & maintenance

Don't allow problem areas to cause more stress than necessary: NiTO allows you to quickly acknowledge and mute alerts and notifications, and schedule downtime.

Get a custom quote... right now.

Select your size, choose your notifications and more for a real-time custom quote with bulk discounts and no hidden fees.

Visit our pricing page
As a business owner, the best benefit of NiTO is that it's an all-in-one solution that doesn't require additional software, or an after-hours answering service to call us about alerts since NiTO does the calling. The monthly cost savings of the all-in-one solution are huge.
Ian C., Industry: Managed Service Provider
The NiTO interface is absolutely brilliant. I love how it has all the displays any sysadmin can dream of in one easy view. Also, the report views are super easy to use, saving me a ton of time, and there were no learning pain points compared to competing products.
Matt VV., Industry: Digital Agency
Nito’s interface provides a powerful holistic view of our infrastructure. It provides valuable insight by allowing us to easily correlate data from different assets. Nito makes troubleshooting trivial and we can often determine the root cause of a problem before even having to log into a server. Nito’s powerful and easy to understand API allows us to monitor our custom in-house applications. I sleep better at night knowing that we have Nito watching our backs.
Matthew V., Industry: Technology Services