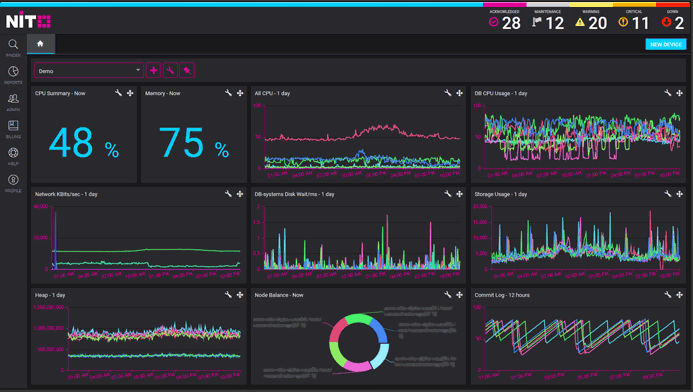
In addition to viewing individual devices and reports, you can stream metrics from multiple devices via Customized Instrument Boards. Customized Dashboards update automatically, making them especially useful for big-screen office overhead displays. Users can create their own Instrument Boards and pin them as the default view to appear when they log-in. Virtually all built-in metrics, and custom metrics that have been added via the RESTful API can be aggregated for custom presentation.
To add an Dashboard, simply click the big plus (+) button on the NiTO homepage in your dashboard (home icon on the main tabs). You’ll be able to add or duplicate boards, and add widgets to your custom boards. You can choose which metrics to display, and how to display them, by clicking the wrench icon on each widget. Widgets can also be moved and resized by drag-and-drop.
